jChartFX Financial Services Documentation
jChartFX Financial Services (JFS) is a set of endpoints that allow developers, webmasters and power users to easily include financial features in their web and mobile applications, as well as blogs and other financial outlets.
There are two types of endpoints included with JFS: Visualization and Data endpoints.
Visualization Endpoints: consist of several types of charts and other visualizations of financial data, that can be readily included in web or mobile applications.
Data Endpoints: series of REST APIs of financial data and indicator calculations that developers can use in their web and mobile applications.
How to integrate jChartFX Financial Services in your applications?
Visualization Endpoints
Integrating visualization endpoints in your applications is as simple as adding an <iframe> to your web page. For example:
<html>
    <head>
        <title>My sample page</title>
    </head>
    <body>
        <iframe frameBorder='0' scrolling='no' width='800' height='420' src='http://api.jchartfx.com/financial/charts/HistoricalQuotes/?app-key=<Your_appkey_goes_here>&symbol=AAPL&days=365&width=800&height=420'></iframe>
    </body>
</html>
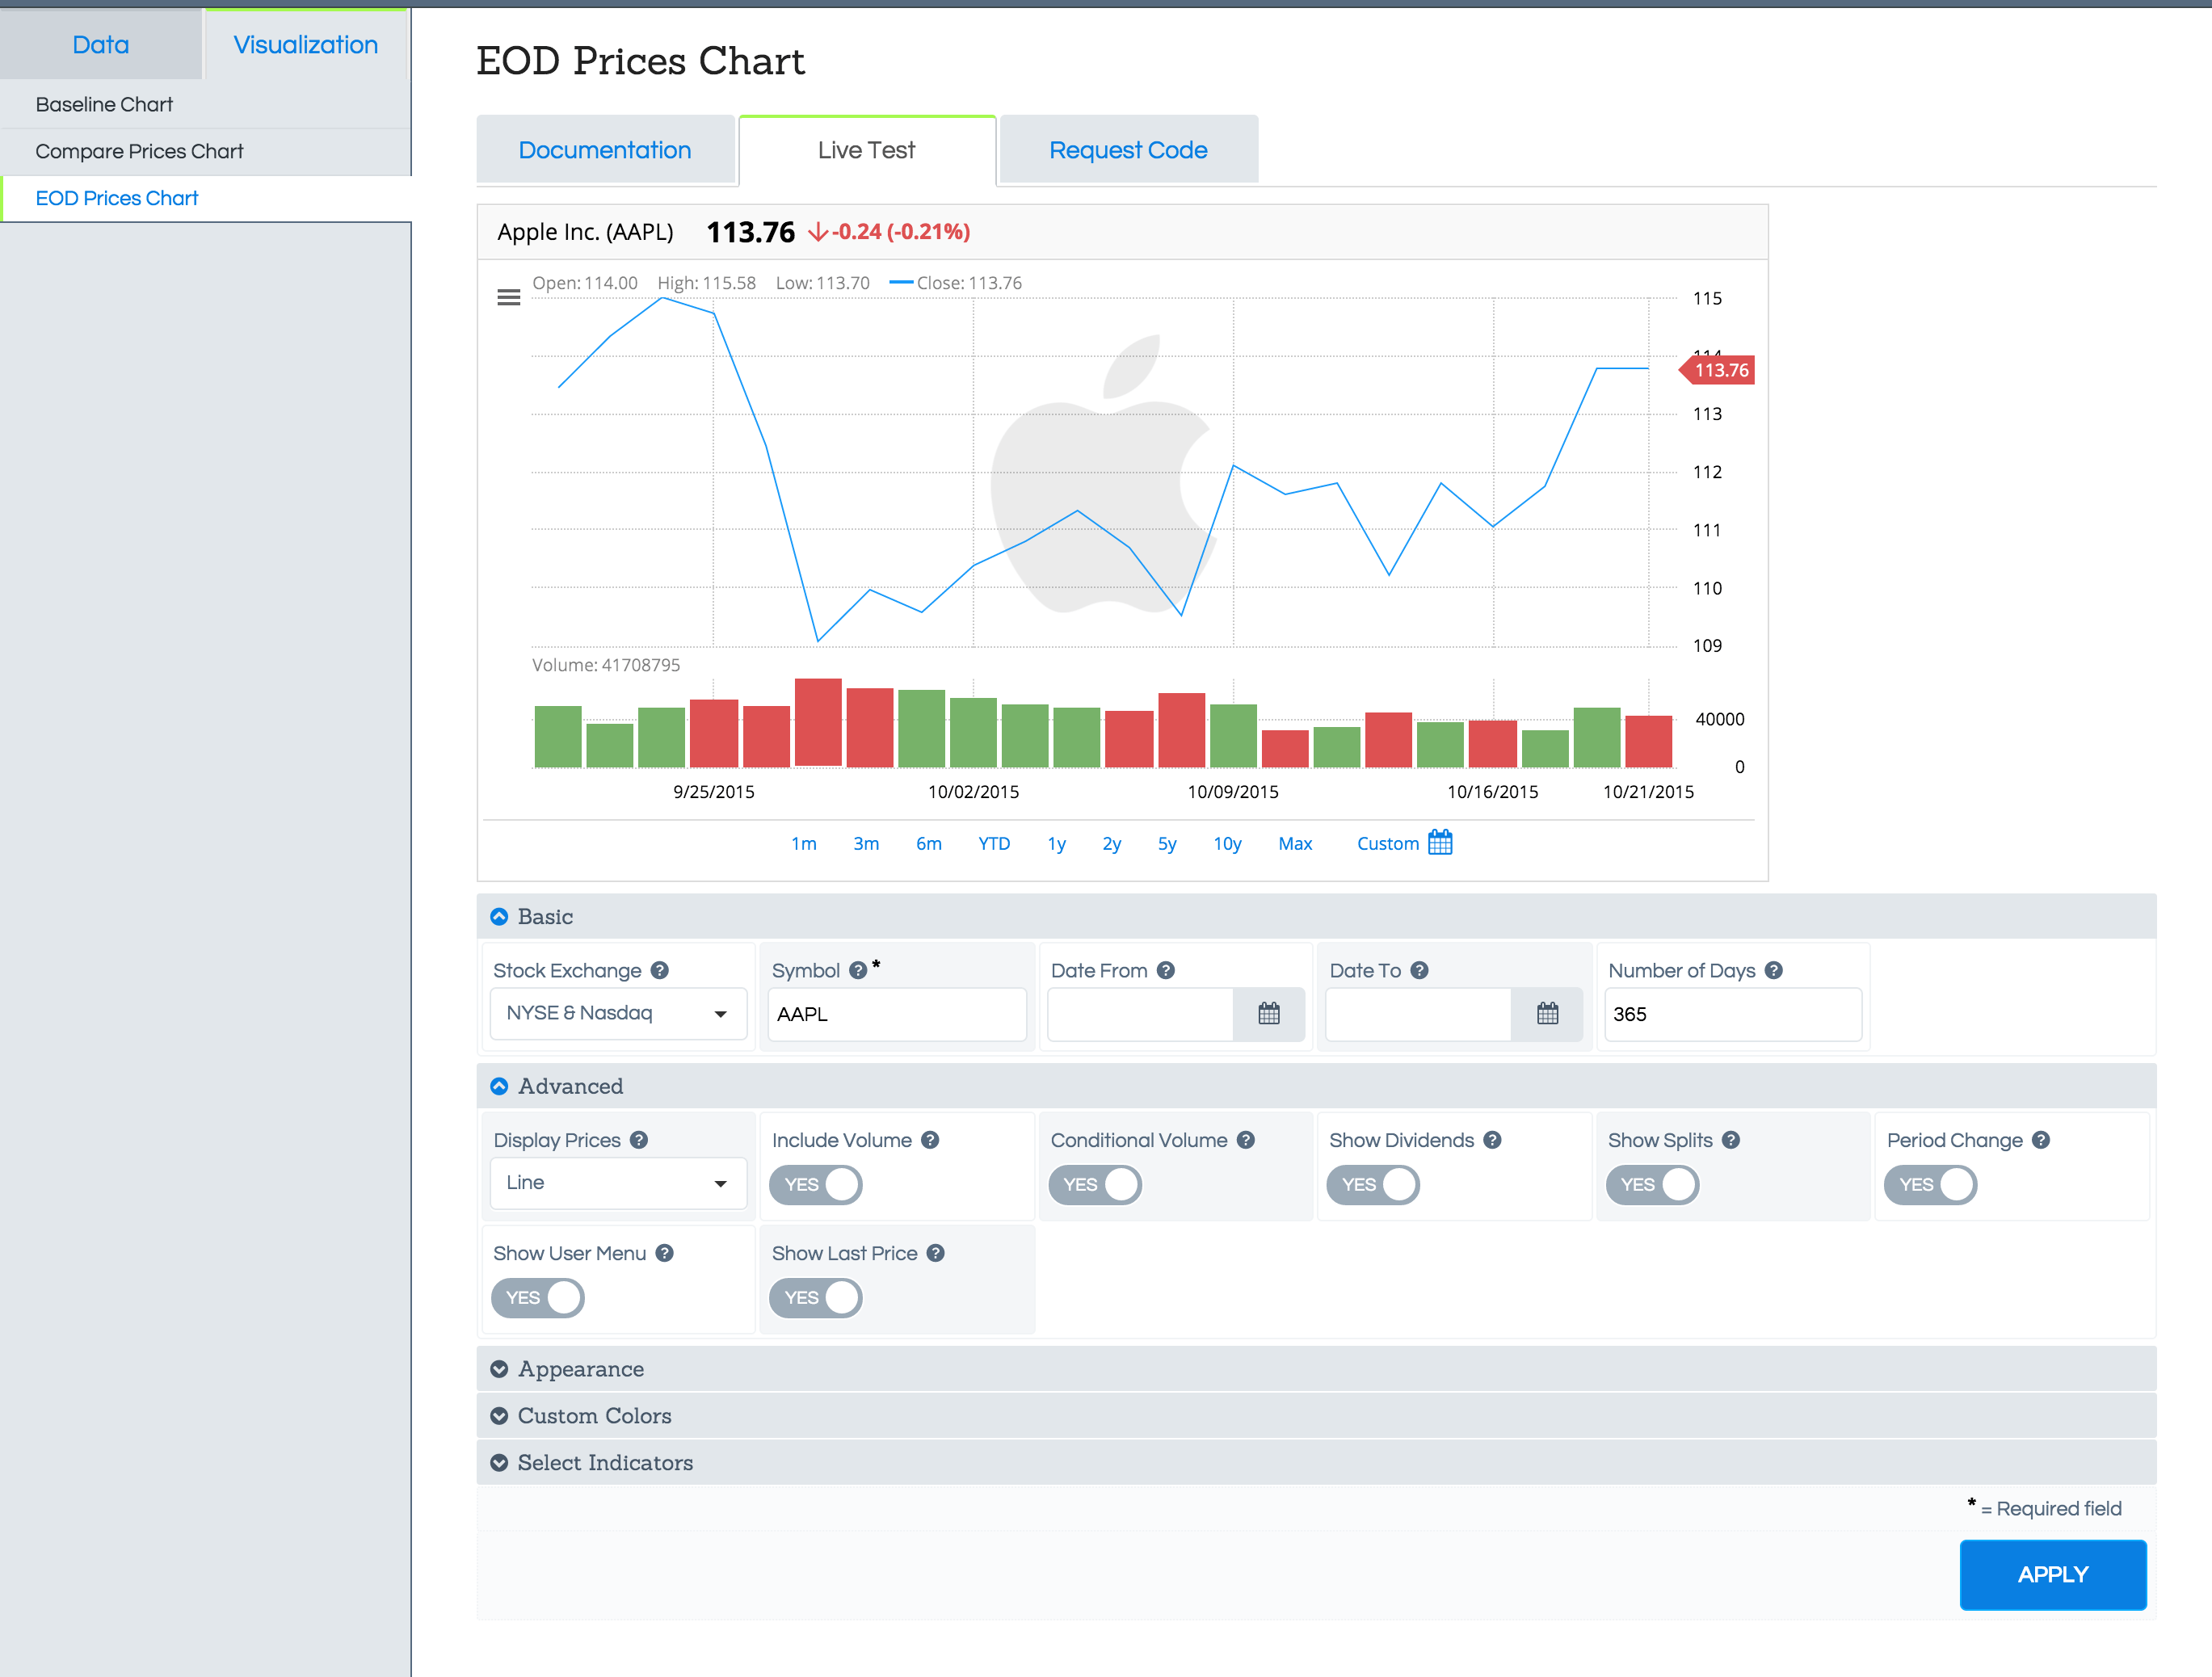
Each visualization supports a number of variables for customization, which are passed as URL parameters. For ease of customization, a comprehensive UI is available at https://service.jchartfx.com/account/services under the Endpoints section. To customize a parameter, enter the corresponding value in the UI, click on APPLY and the visualization will be updated accordingly, as shown below:
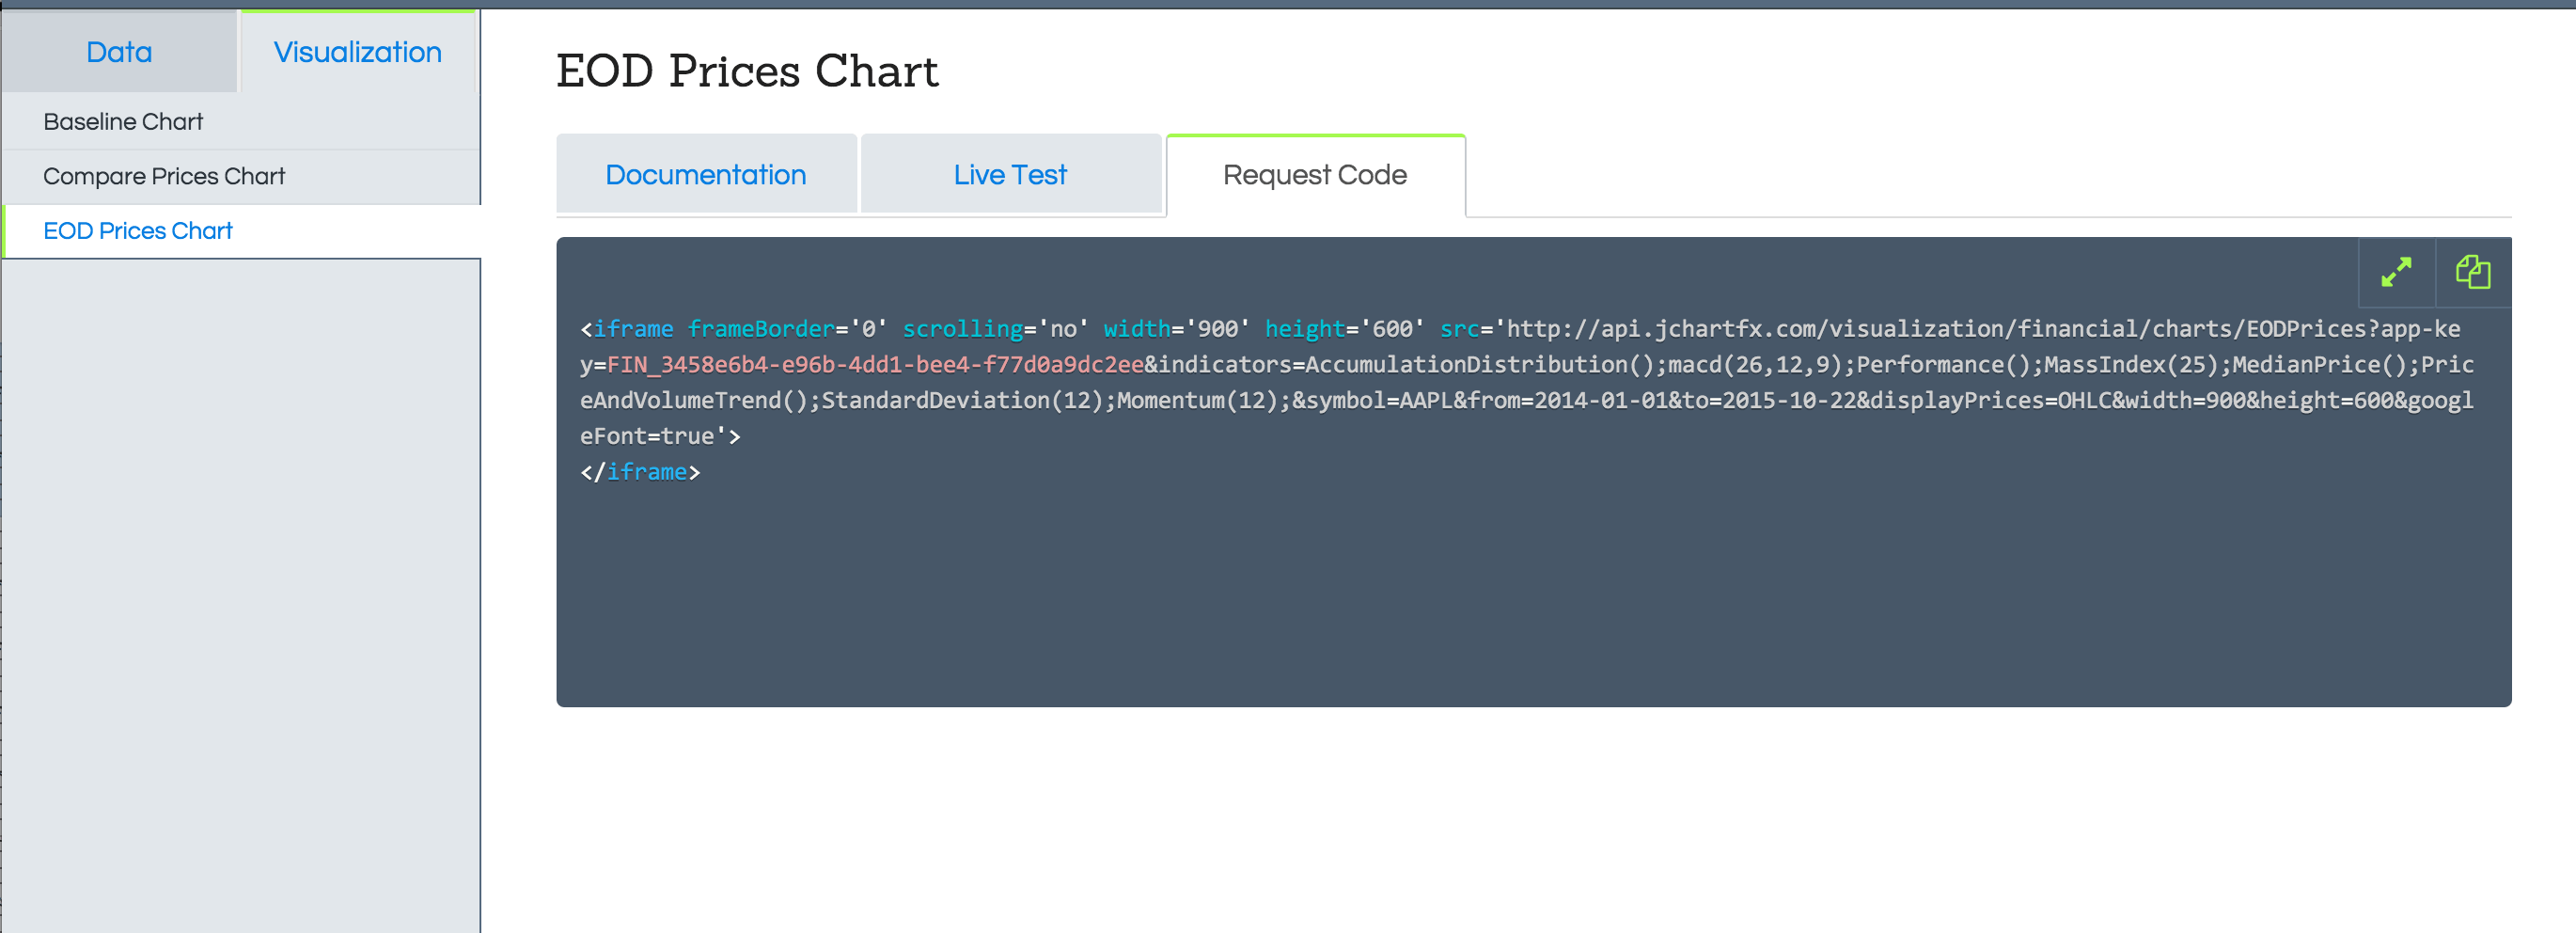
Once you have customized the visualization to your needs, copy the <iframe> code from the Request Code tab.
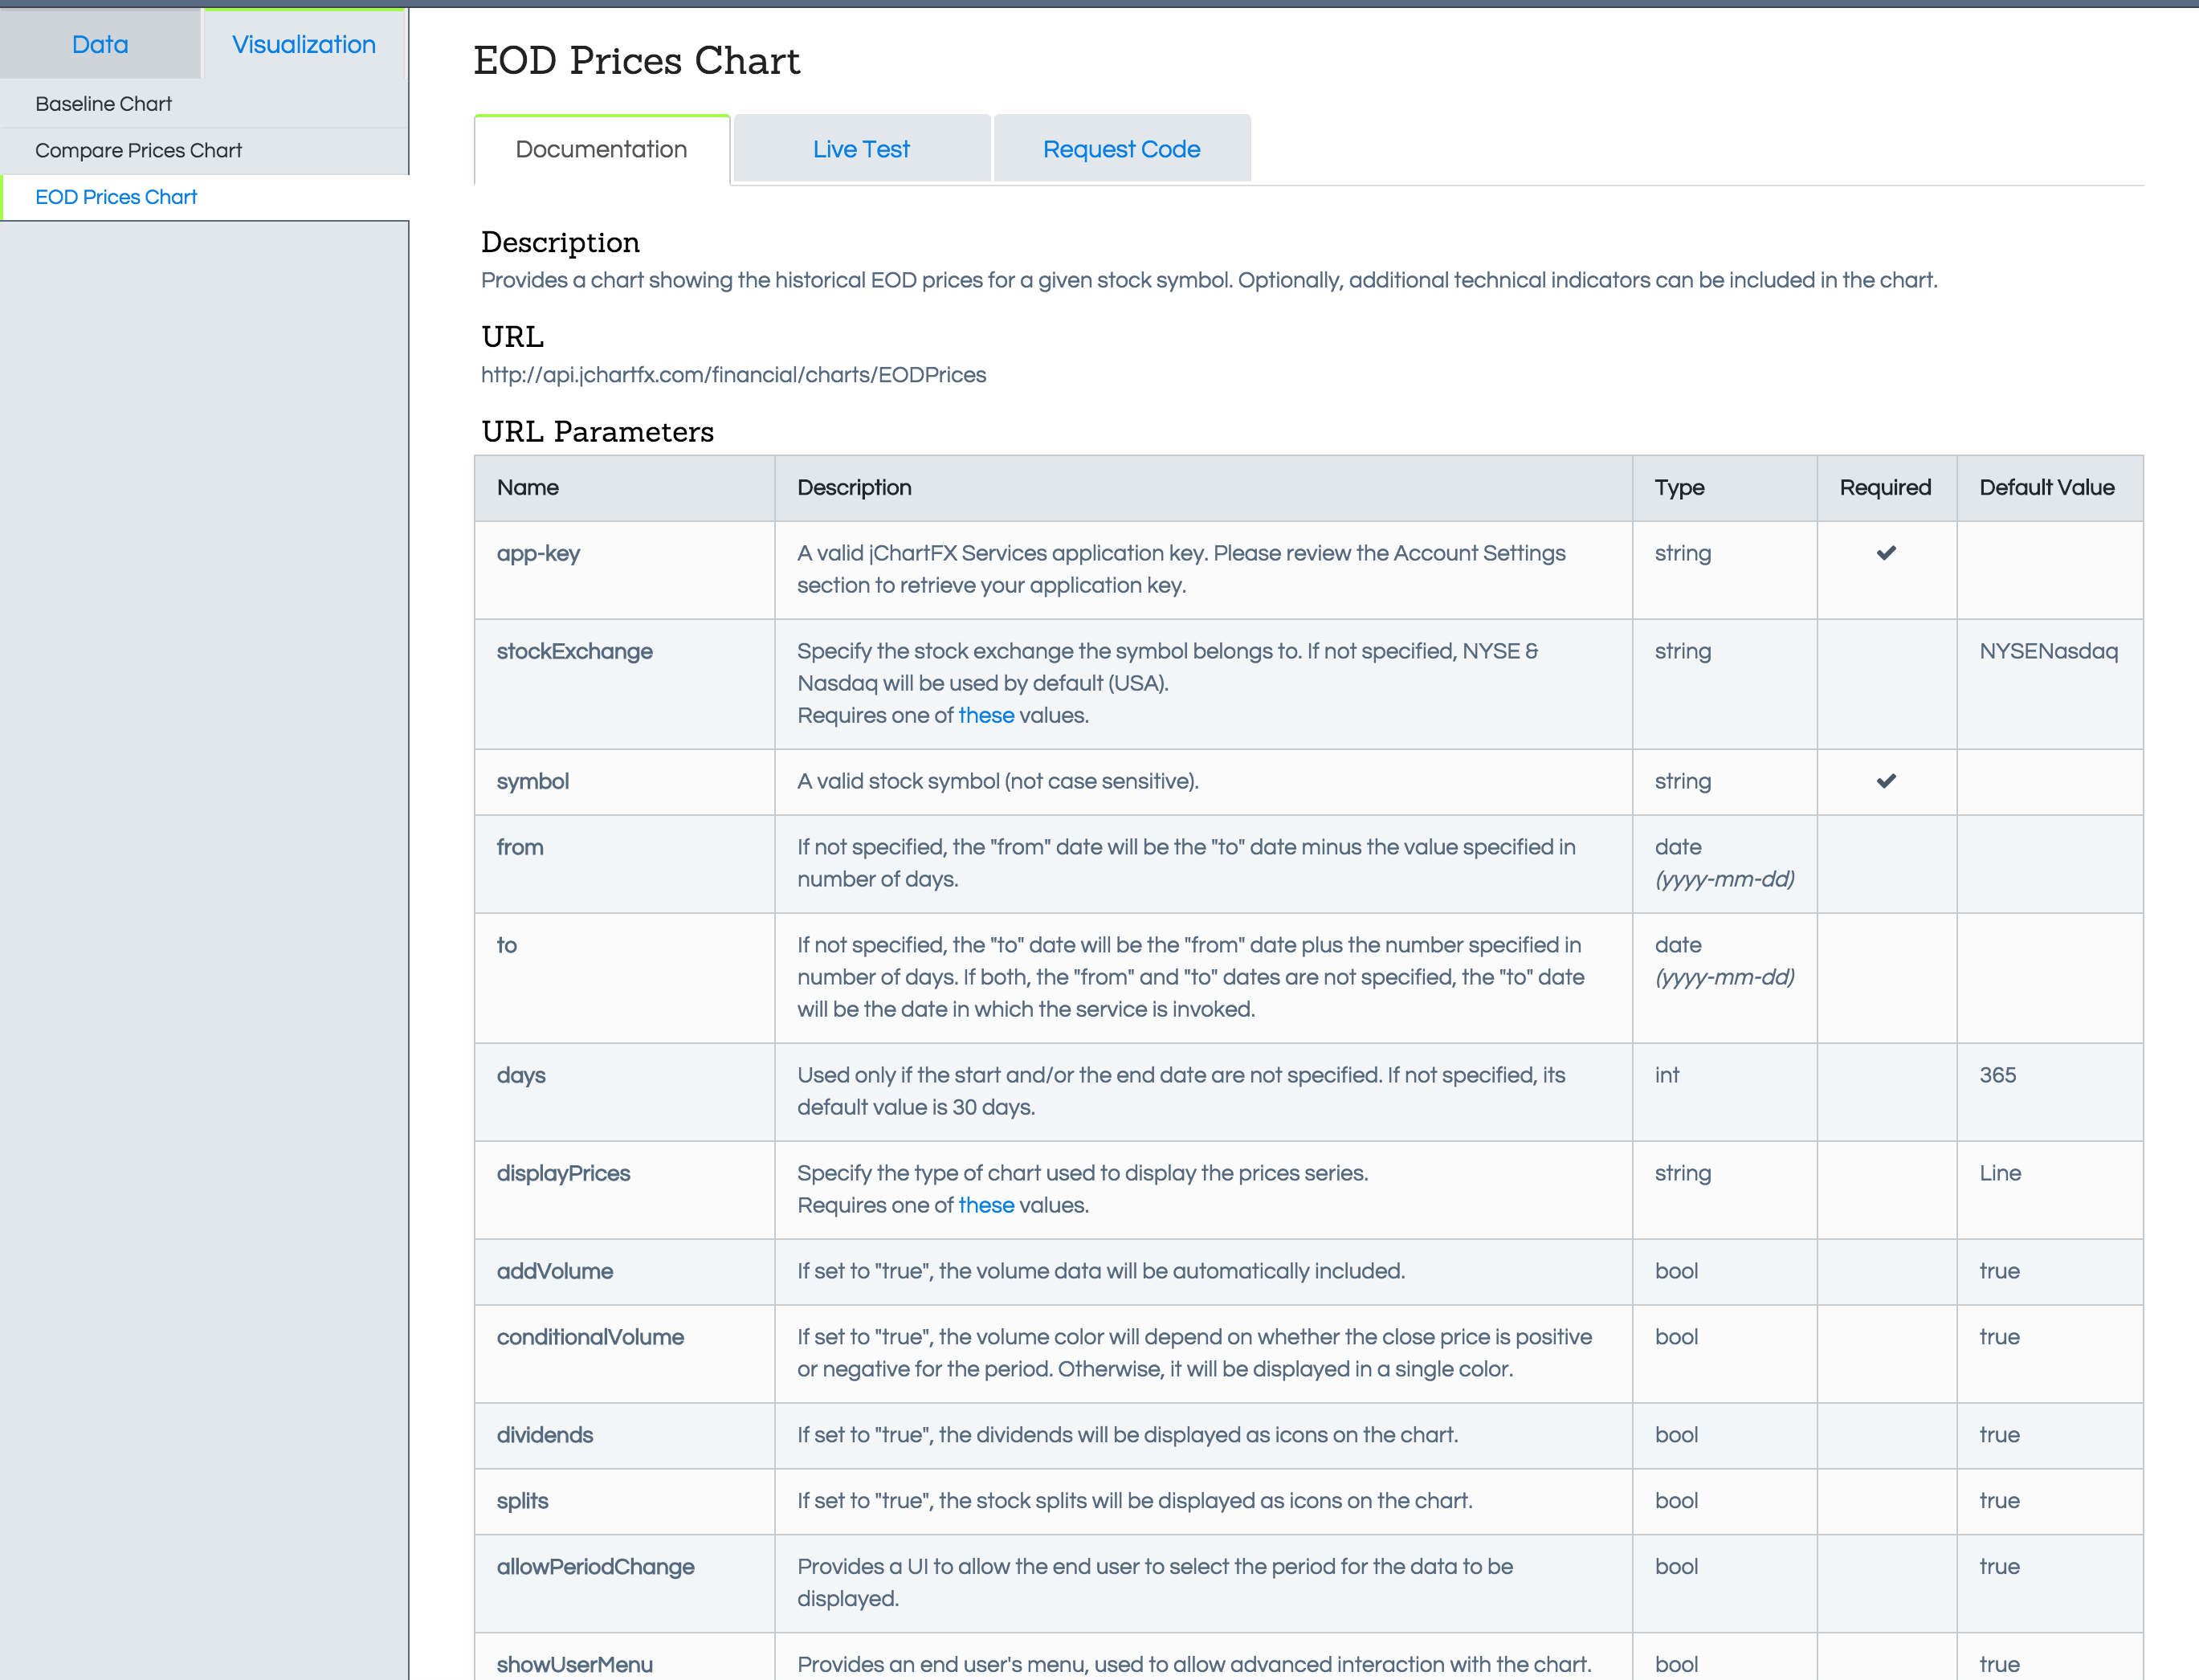
For more interactive applications, the URL can be modified programmatically. Details of values supported for each of the parameters are available in the Documentation tab.
Data Services
jChartFX Financial data endpoints are exposed as REST APIs that can be integrated into your application, using your framework and language of choice. Each data endpoint supports a number of variables for customization, which are passed as parameters to the GET method. Complete documentation of values supported by each parameter is available in the Documentation tab.
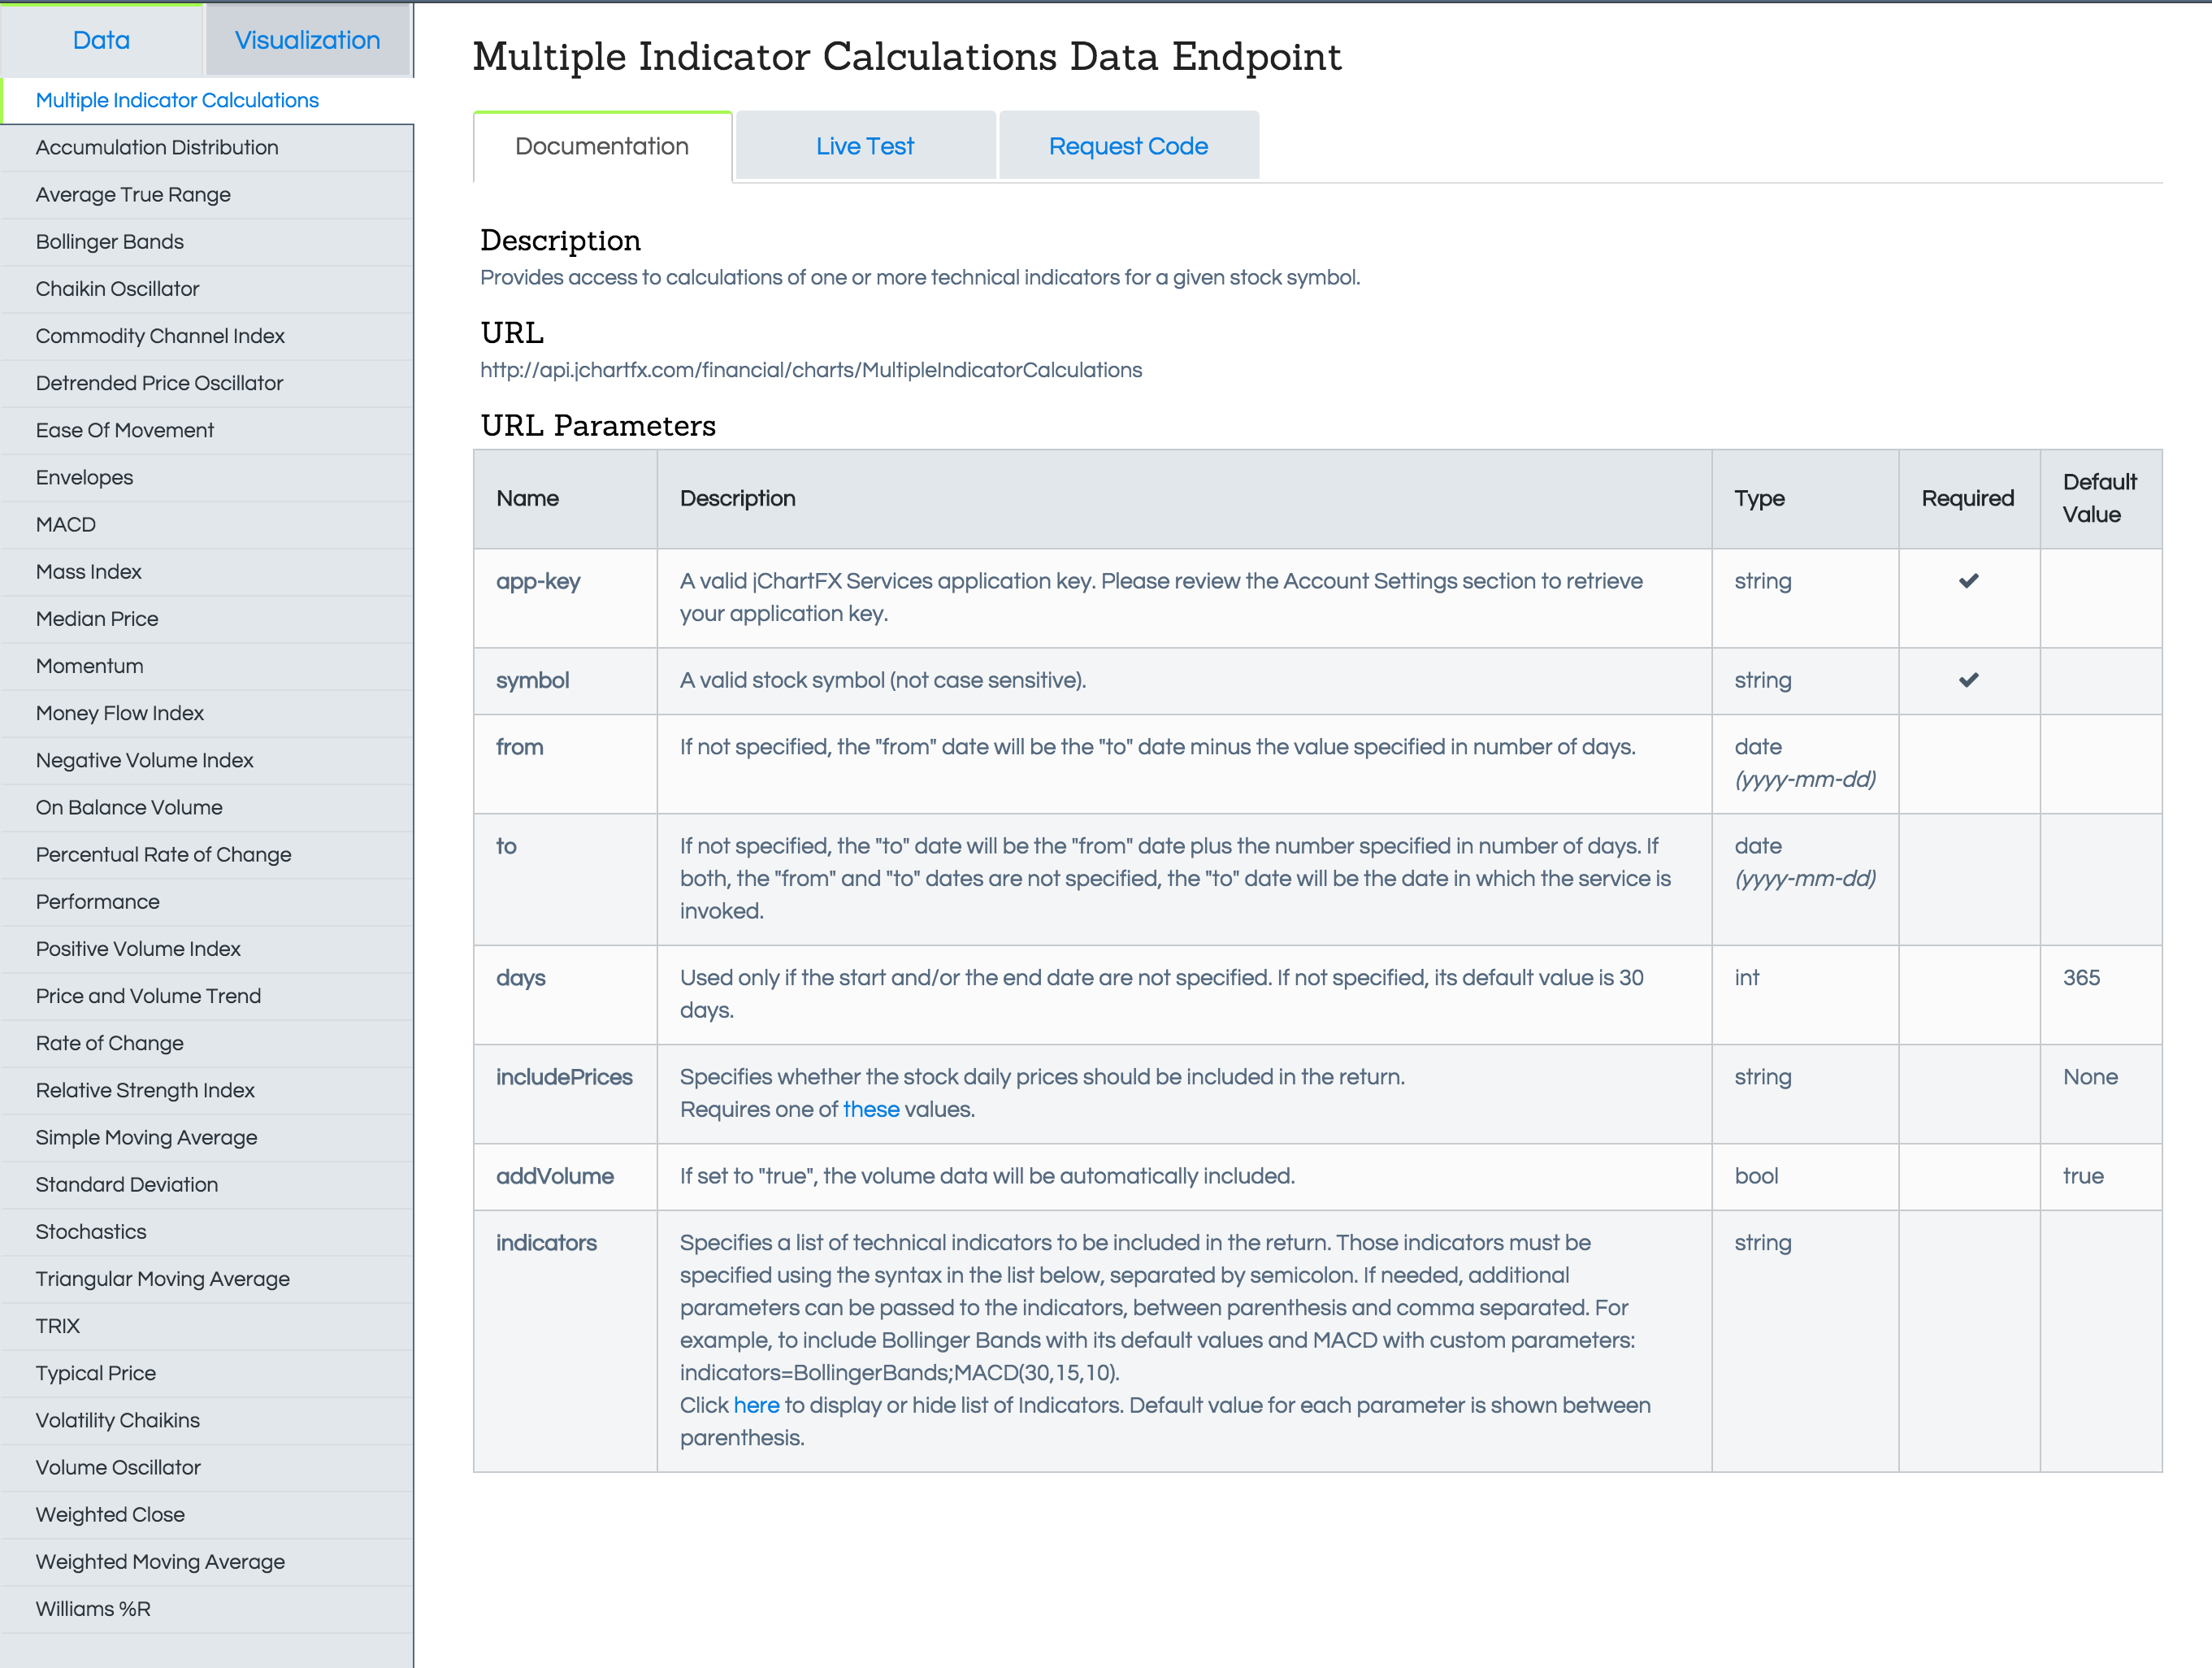
For ease of customization, a comprehensive UI is available for each endpoint. To customize a parameter, enter the corresponding value in the UI, click on APPLY and the Sample Response section will be updated accordingly, as shown below:
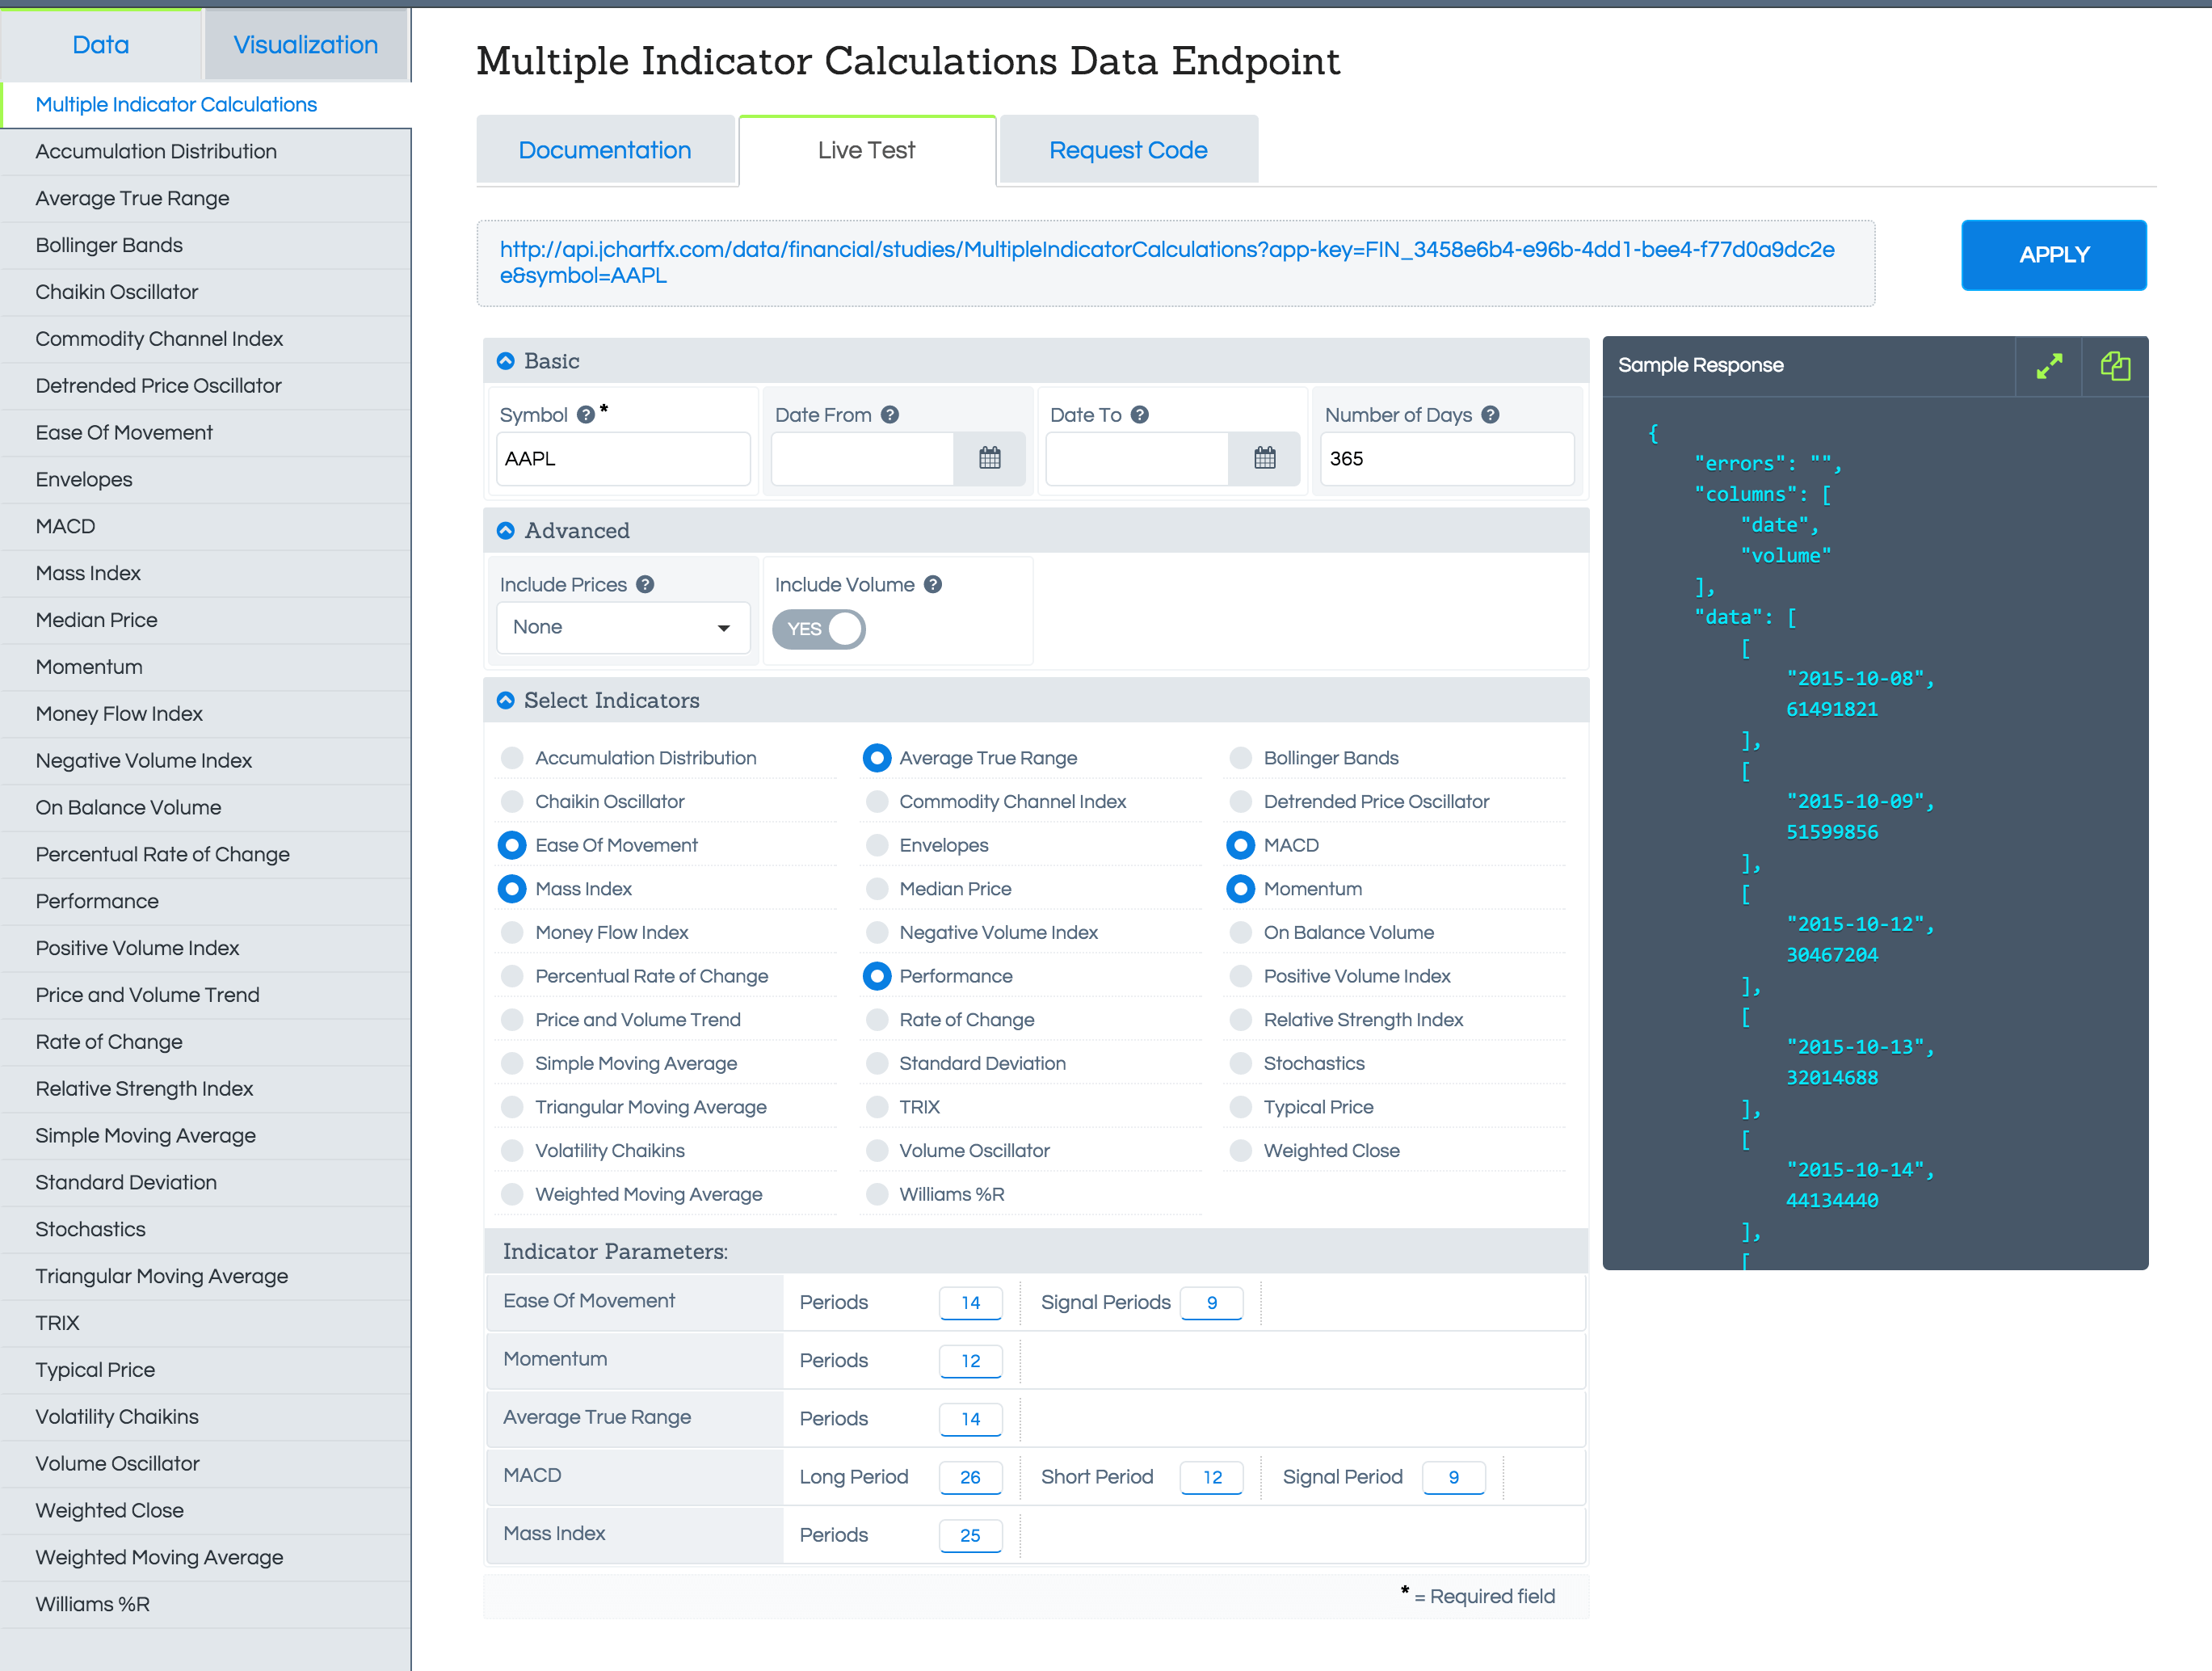
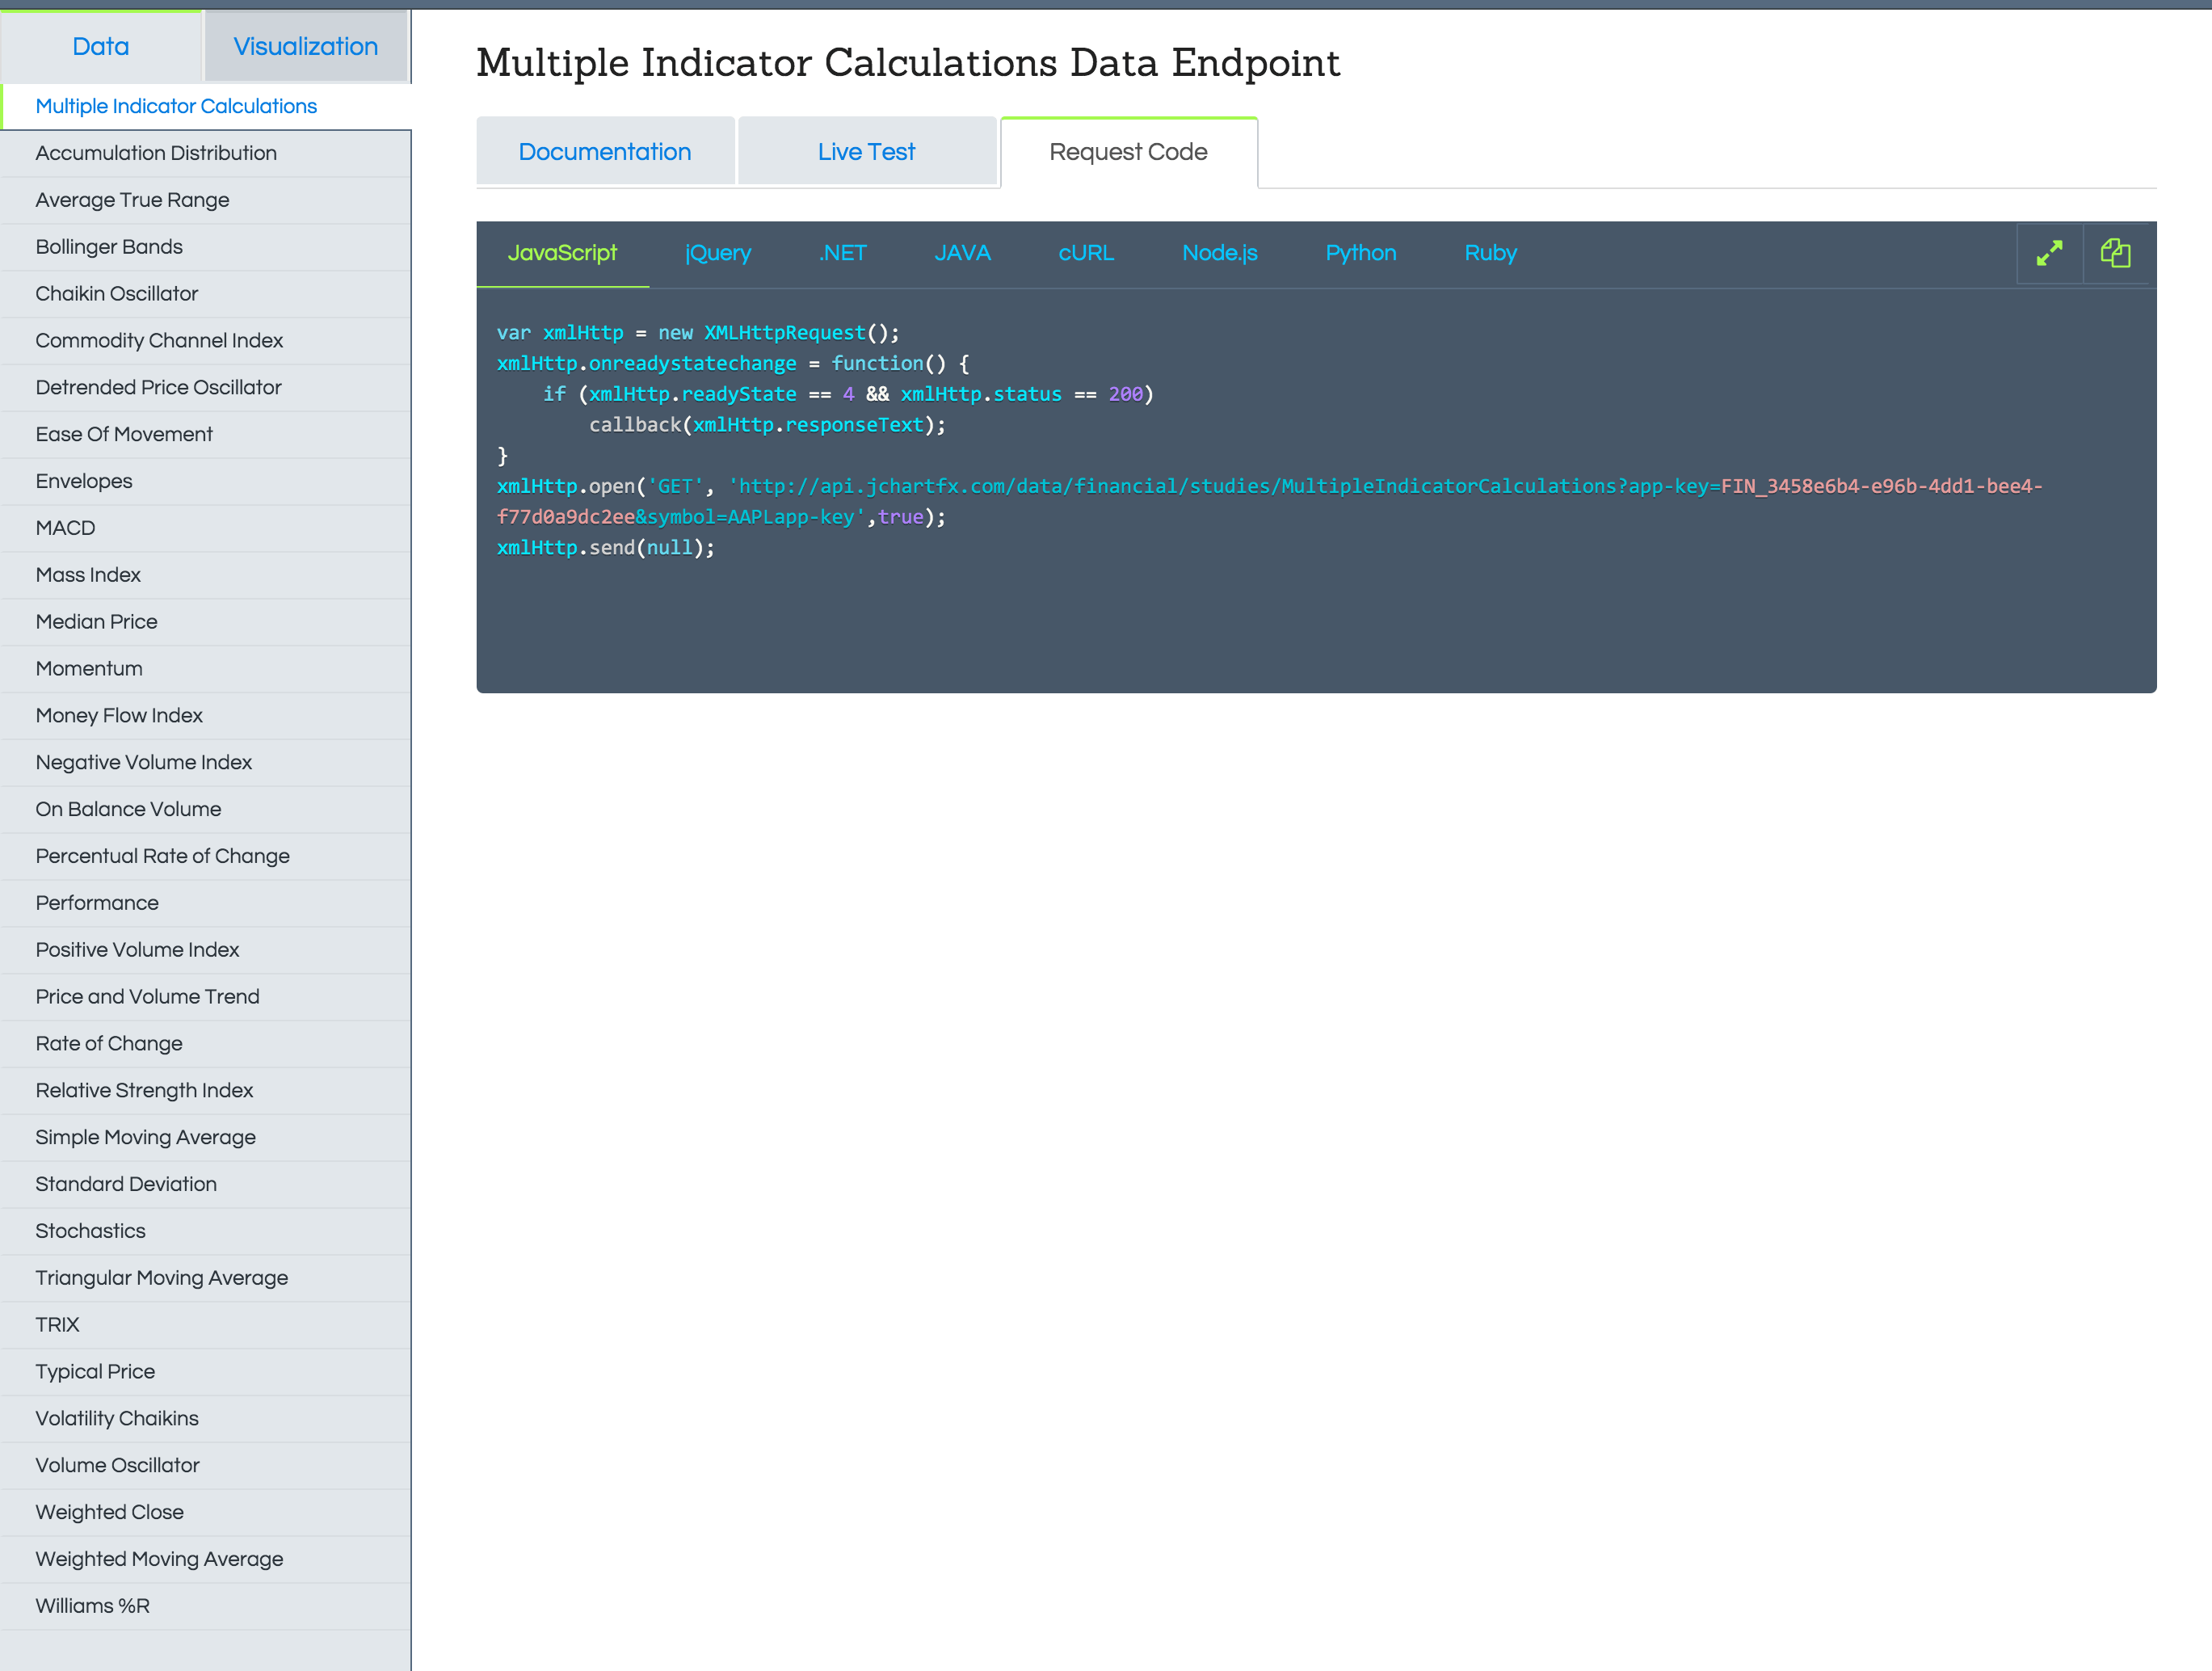
Once you have customized the endpoint variables to your needs, copy the corresponding code from the Request Code tab. The code for several languages and frameworks is included with the service. If you don’t see request code for the language or framework you are using, please contact our support team at support@jchartfxservices.com and they will be able to assist you.
Applications, Application Keys and Plans
In order to use any of the visualization or data services you need an application key (app-key), which must be passed as a parameter with every request. The app-key will be used to compute the number of calls and other analysis. You can create as many app-keys as you want, and you will be able to obtain detailed analysis per app-key. For example, you can create an app-key for your web application and another one for your mobile application. You can even assign a friendly name to your app-key for ease of analysis.
For further control, you have the option to create multiple applications, and have as many app-keys as you want, per application. You can show detailed analytics per application.
Each app-key must be assigned to a specific plan. When you first sign up for the service, a free plan is automatically created for you, along with one application and one app-key. You can later add additional plans to your account. For details of the different types of plans available, please contact our sales team at sales@jchartfxservices.com. Once you have added a new plan to your account, you can assign any of the existing app-keys to the plan, or add a new app-key.
